

The best data analytics project ideas for freshers all start with a business question, not a tool. Which product sells best? Why do customers stop buying? Which department keeps losing people? A fresher who answers a question like that with a clean dashboard and a short recommendation already looks like an analyst, even before the first job.
Picture two resumes on a hiring manager’s desk. Both list Excel, SQL and Power BI. One of them also links to a sales dashboard that spotted the months when revenue dipped and explains why. The second resume is simply easier to trust.
This guide covers 10 data analytics projects for beginners, grouped by level, with the tools each one uses and the question it answers. Freshers still deciding whether this career fits can read how to become a data analyst in Pune first.
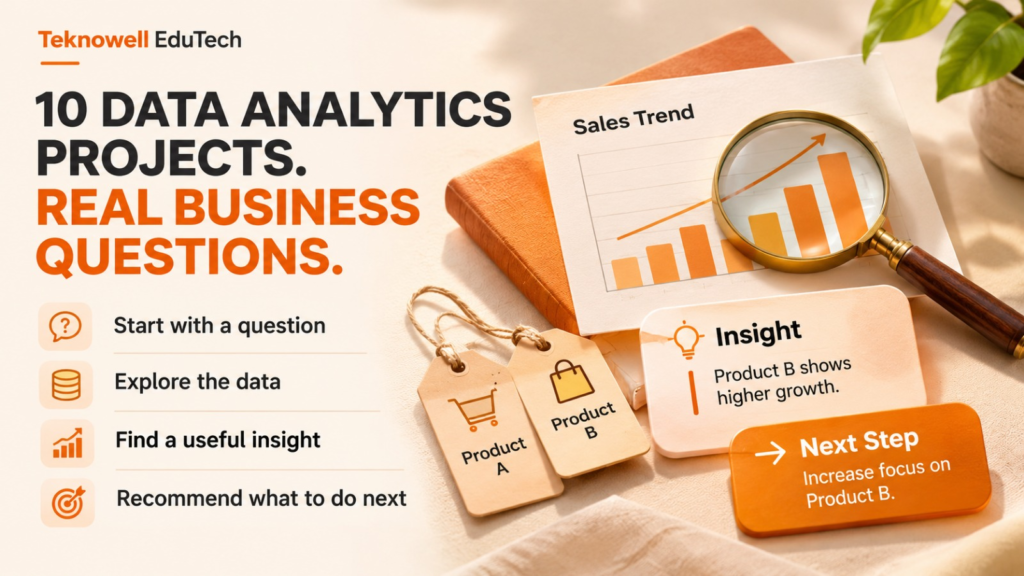
What Should a Data Analytics Project Include?
Every good data analytics project must have five elements: a business question, a data source, a cleaning stage, the actual analysis and a dashboard or report ending with a recommendation. If any of those elements are missing, the project will simply turn into a set of charts.
- Business question. What is the question the project aims to answer?
- Data source. What is the source of the data used, and is it free to access?
- Cleaning. Why did the data need to be cleaned and how?
- Analysis. What calculations, queries or charts give the answer to the question?
- Recommendation. What is the recommendation for the business based on the results?
The recommendation is the step freshers most often overlook, but it is also the most important one. “Sales decreased in March” is an observation. “Sales decreased in March because best-selling products ran out of stock, so the stock alerts must be changed” is the analysis.
10 Data Analytics Project Ideas for Freshers at a Glance
| Project | Level | Tools | Business question |
| Excel sales dashboard | Beginner | Excel | Which products and months earn the most? |
| Messy data cleanup | Beginner | Excel or SQL | What was wrong with the data, and how was it fixed? |
| Retail SQL questions | Beginner | SQL | Who are the top and repeat customers? |
| HR attrition dashboard | Intermediate | Power BI | Which teams lose the most people? |
| Customer segmentation (RFM) | Intermediate | SQL, Power BI | Which customers are loyal, and which are slipping? |
| Restaurant ratings and pricing | Intermediate | Tableau or Power BI | Does a higher price mean a better rating? |
| Public data trend report | Intermediate | Excel or Power BI | What changed over the years in one chosen topic? |
| End-to-end sales analytics | Advanced | SQL, Power BI | What should the business do next quarter? |
| Customer churn analysis | Advanced | Python | Why do customers leave? |
| Funnel and retention analysis | Advanced | SQL, BI tool | Where do shoppers drop off? |
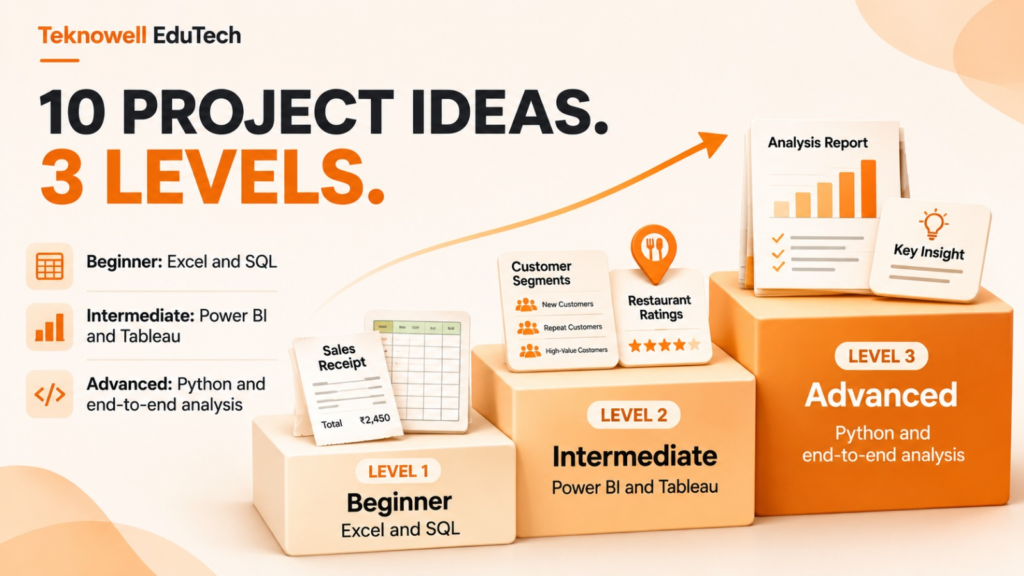
Data Analytics Projects for Beginners: Start With Excel and SQL
Beginner projects work best in Excel and SQL, because both are quick to learn and nearly every analyst job description asks for them.
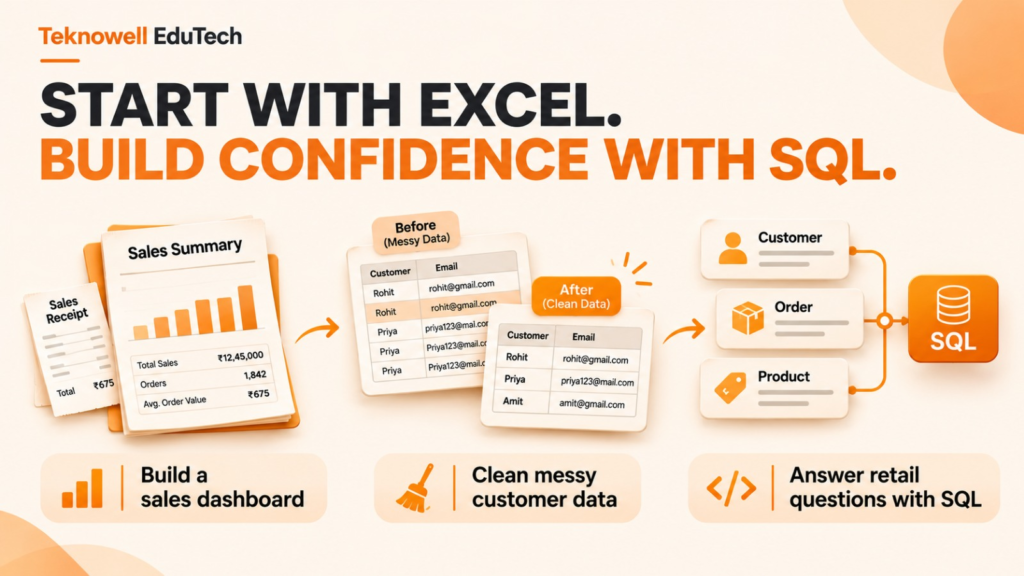
1. Excel dashboard project. Take a year of sales data and build a one-page dashboard with pivot tables, slicers for region and category, and a few KPI cards such as total sales, profit and top product. It’s also the easiest project to explain out loud, which matters a lot once interviews begin.
2. Messy data cleanup. Real data is untidy. Find a customer file with duplicates, blank cells and a city spelled three ways (Pune, PUNE, and Pune with a stray space) and clean it. Keep a before-and-after screenshot. Cleaning isn’t glamorous, but it’s a big part of an analyst’s week, and showing it is a quiet way to stand out.
3. Retail SQL questions. SQL projects for data analyst roles don’t need fancy data. A small retail database with customers, orders and products is enough. Who are the top 10 customers by spend? Which customers ordered more than once? What’s the revenue by month? Answering these uses joins, GROUP BY and filters, which come up often in interviews, and the IT interview questions guide for freshers covers the usual ones.
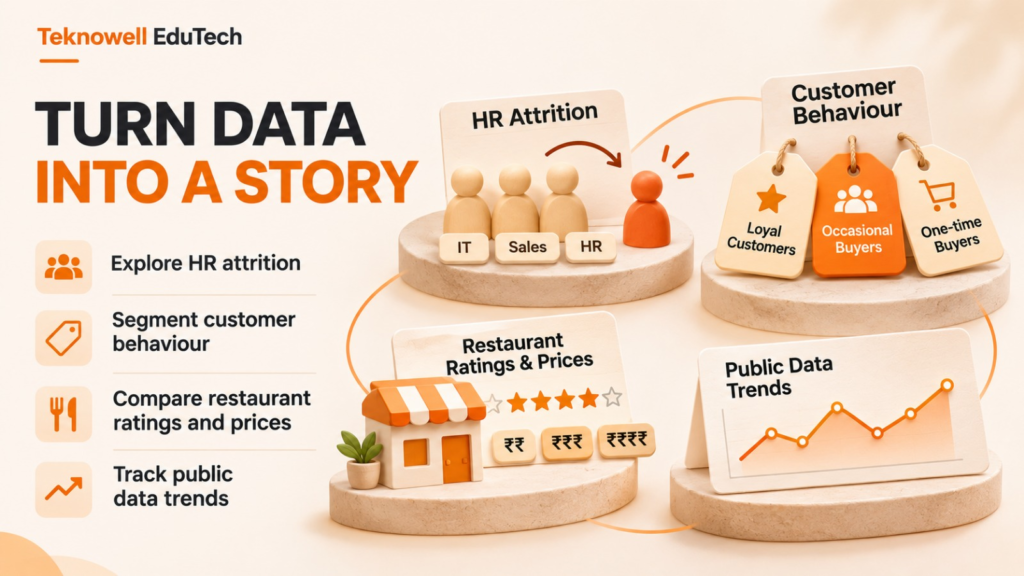
Power BI Projects for Beginners That Look Like Real Work
Once Excel and SQL feel comfortable, Power BI or Tableau turns the same analysis into interactive dashboards, which hiring teams often like to see.
4. HR attrition dashboard. Staff data shows who left the company and who stayed. Create a dashboard on attrition by department, age and tenure group, and write two lines on where the problem lies. This Power BI project is very friendly for beginners because it tells an understandable story.
5. Customer segmentation using RFM. RFM means recency, frequency and monetary value: when a customer last purchased, how often they buy and how much they spend in total. Group customers into loyal, recent and slipping, then recommend how to act with each group. SQL handles the scoring, and Power BI provides the visuals.
6. Restaurant ratings and prices. Find a public dataset for restaurants in one city and analyse cuisine type, price and rating. Is it true that more expensive restaurants are rated better? In which areas are too many similar restaurants located? It is quite an interesting project.
7. Public data trend report. India’s Open Government Data Platform shares datasets from central and state governments in sectors like agriculture, healthcare and transportation under the government’s open data licence. Choose any one sector, analyse its trend over the years and explain what you observe.
Dashboards are where most freshers get lost. The data is there, but the charts seem off, and they have no idea how to correct them. Troubleshooting issues like these is an essential part of becoming a job-ready data analyst.
The Data Analytics course by Teknowell EduTech in Pune includes Excel, Advanced Excel, SQL, Power BI, Tableau, live projects and internship assistance, along with placement assistance and mock interviews.
Want to see how the course works before enrolling? Book a free demo class.
Advanced Data Analyst Portfolio Projects
Advanced projects link tools together and end with a recommendation, which is how real analyst work looks.
8. End-to-end sales analytics. This is the capstone for a data analyst portfolio. Pull the data with SQL, clean it, build a Power BI dashboard and finish with a one-page recommendation on what the business should do. One project like this can anchor a portfolio.
9. Customer churn analysis with Python. Use Pandas and Matplotlib to analyse customer data, identify who stopped using a service and uncover common patterns, such as short customer tenure, high bills or low purchase frequency. This project helps you practise data cleaning, exploratory data analysis and visualisation. Python is also covered in Teknowell EduTech’s Data Science course. If you’re unsure which path to choose, read Data Analytics vs Data Science to understand the differences.
10. Funnel and retention analysis. Track shoppers from visit to cart to purchase to see where they drop off, then check how many first-time buyers return the next month. SQL does the counting, and a BI tool draws the picture.
Where to Find Free Datasets for Portfolio Projects
Choosing the right dataset is another essential part of a data analytics project. Besides official government sources, websites like Kaggle and Google Dataset Search offer free datasets on topics such as sales, healthcare, finance, marketing and customer behaviour.
Before selecting a dataset, make sure its licence allows you to use and share it in your portfolio. Also look for data that gives you enough to study one specific problem. With a sales dataset, for instance, you can find out which products perform well, compare revenue month by month and spot seasonal patterns. Do not just copy someone else’s project from a tutorial. Working with unfamiliar data and explaining your process makes you more attractive to employers.
How to Present Data Analyst Projects on a Resume and GitHub
Finishing the project is only the first half. You also need to present it so recruiters quickly understand what you did, which tools you used and what you found.
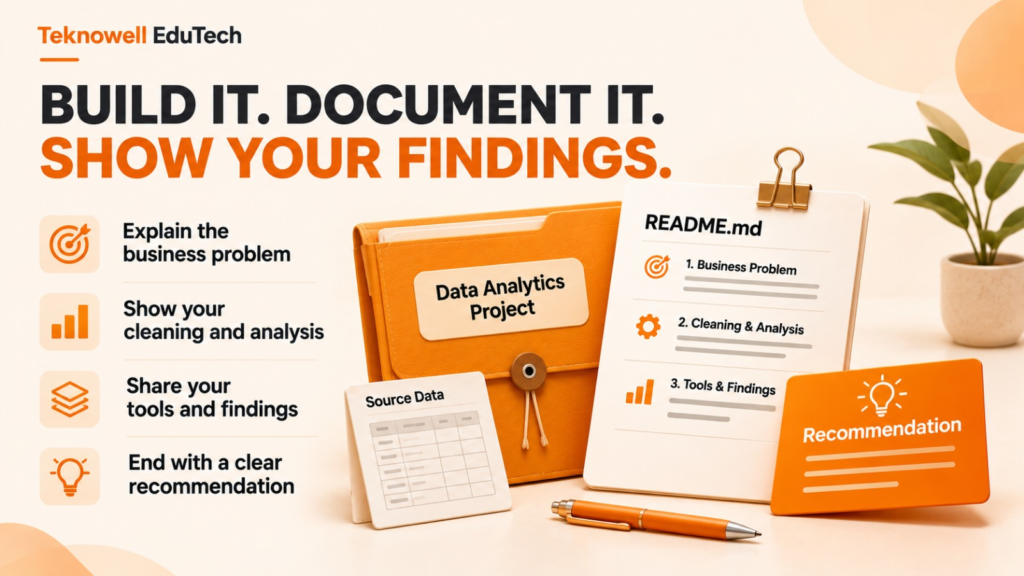
On GitHub, create a new repository for every project. Include your SQL scripts or Python notebooks, a README describing the problem and solution, the dataset source, your findings and screenshots of your dashboard where relevant. Keep it tidy and clear so anyone can follow your process without an explanation from you. Our guide to building a GitHub portfolio covers the rest.
On your resume, don’t just name each project. Add the tools you used and one finding. For example: HR Attrition Dashboard (Power BI): analysed employee attrition by department and found trends that can help HR address retention. Use only findings your project actually supports. For more help, go through these fresher IT resume tips.
Mistakes Freshers Make With Data Analytics Projects
Your project may show real analytical thinking, but only if the evidence is presented properly. Here are three errors to avoid when presenting your data analysis:
- Creating charts without explaining the findings: Do not just show a decline in sales in some month. Work out which products or territories caused the drop and interpret the data.
- Too many visuals in the dashboard: Adding a lot of charts makes the key point harder to see. Select only the visuals related to your analysis question, then name and organise them properly.
- Ignoring the data cleaning process: Real-life datasets usually include missing values, duplicates and inconsistent formatting. Explain how you handled these problems and check the accuracy of your calculations.
The purpose is not to make the project complicated. It’s to show that you can work with data, investigate a problem and explain your findings clearly.
Can Someone From a Non-Tech Background Start Data Analytics Projects?
Yes. Prior knowledge of computer science is not required to start in data analytics. Beginners can sort, filter, apply formulas, build pivot tables and make reports in Excel before moving on to Power BI and SQL. This builds skills even without any programming knowledge.
For example, someone from a commerce background may want to analyse sales and compare revenue, margins and performance. Someone specialising in business can analyse customer feedback or employee attrition.
Once you’re comfortable with the basics, you can progress to Python for data cleaning, analysis and automation. The important thing is to start with a manageable project and build on it rather than trying to learn every tool at once. If you’re considering a career transition, this guide to switching to IT after BCom or BBA can help you explore the available paths.
Ready to Turn These Into a Portfolio?
Pick one beginner project this week, finish it, then move up a level. Three or four solid projects with clear recommendations will say more than a long list of tools.
Need guidance on what to learn and how to build practical skills? Teknowell EduTech offers Data Analytics training online and at its Chinchwad centre, with placement assistance. Book a free demo class to explore the course, understand the learning approach and decide if it fits your career goals.